Soft Commodity Signals

A weekly regional read on crop condition, in your model before the report posts.

Vegetation-index curves and planted-area estimates for grain and oilseed growing regions, from wide-swath multispectral passes. A time series you can load, plus a map layer.

The files

FileFormatWhat's in it
Regional index curveCSV time seriesOne row per growing region per week, holding the vegetation-index value for the crop year. Weekly through the season. Loads into a notebook, a spreadsheet model or your own time-series store.
Planted-area estimateCSV time seriesAn area estimate per growing region and crop, updated weekly through the season. Units follow the region: acres for the US, hectares elsewhere.
Anomaly flagCSV columnA flag on each region-week where the curve sits away from the same week in prior seasons, with the comparison in the file so you can rebuild it against your own baseline.
Map layerGIS layerThe same regional values drawn on the map, for the desk that wants to see where a divergence sits before opening the numbers.

Where it fits in your week

Monday
Crop Progress posts and the condition ratings move. Open the latest regional curve next to them and see whether your regions agree with the state-level number or pull away from it.
Before a WASDE
Run the anomaly flags against the last few releases and against your own balance-sheet view. Where a region has diverged, that is where the desk's discussion starts.
Against your scouts
Scout calls and broker notes stay in the process. The series gives them something regular to be checked against, region by region.

How it works

  1. 1You supply

    You name the growing regions

    Send the regions and crops you trade against. Region boundaries are agreed with you before the first delivery.

  2. 2Collected

    Weekly passes

    Wide-swath multispectral imagery is collected across your regions each week of the season.

  3. 3Computed

    Index and area

    A vegetation index is computed per region, and the planted-area estimate is fitted from it.

  4. 4Delivered

    The files arrive

    The curve, the area estimate and the flags land on your weekly schedule, ready to load.

Limits

Cloud cover
Persistent cloud over a region can blank a week's optical read. That week is flagged in the file, not filled in.
Regional resolution
At 10–30 m the pixels are too coarse for a field-level read, so the series describes a growing region and cannot describe a single field.
Weekly cadence
The series is weekly. It runs ahead of a monthly release by weeks, and it is not a daily feed.
Condition and area only
This is a read on condition and planted area. It does not carry a yield forecast, and there is no yield guarantee.
Beside the official reports
It gives you an independent, faster-moving series to compare with USDA and WASDE releases. It does not reconcile with them or replace them.

Between the Monday reports

Your desk reads the crop off the official calendar: Crop Progress on Monday, WASDE once a month, the acreage reports in spring and summer. Between them you have scout calls, broker notes and the odd satellite chart someone on the team pulled together.

When a region turns before consensus does, the position was built on last month's picture. This exists to give the analyst a regular, regional series to set beside the official numbers, not to stand in for them.

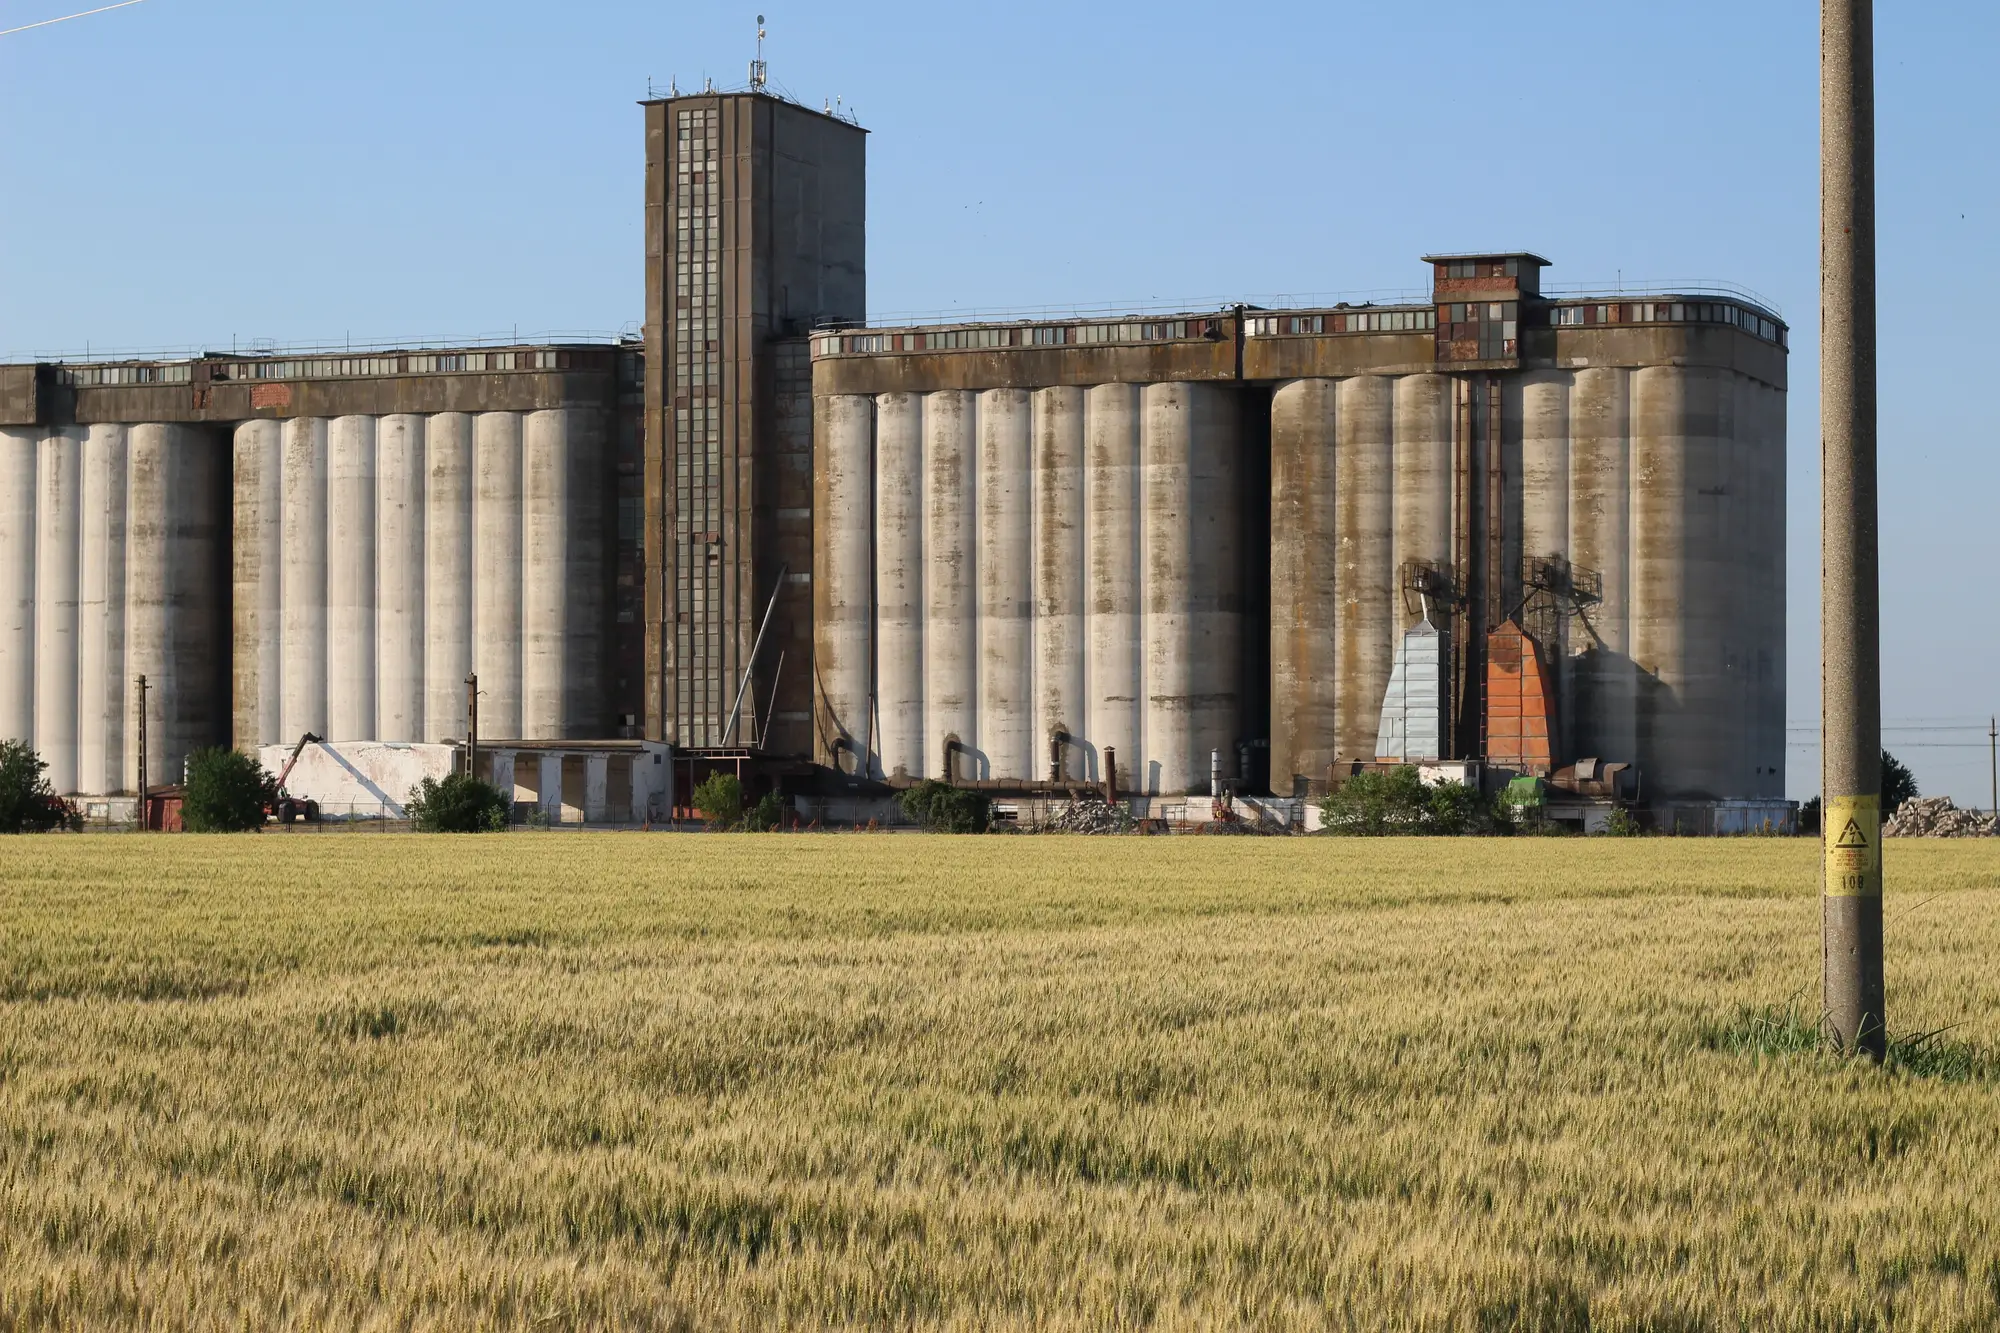
Concrete grain elevators standing behind a ripening wheat field
Elevators at the edge of a wheat field.

Who it's for

Built for

  • Grain and oilseed traders who position ahead of official crop reports
  • Crop analysts and quants who want a regional series to load into their own model

Not for

  • Farm-level or field-level agronomy
  • Desks that need a daily or live feed
  • Desks looking for a yield forecast with a guarantee
  • Teams that want a single-farm or single-field read

Questions from the desk

Does this replace WASDE or Crop Progress?

No. It is a separate series that moves weekly, meant to sit beside the official numbers.

How far ahead of the report does it run?

By weeks, tied to the weekly cadence. It is not daily.

Which crops and regions can I ask for?

Grain and oilseed growing regions. Tell us the crops and regions you trade and we confirm what the feed covers before you subscribe.

Is it field-level?

No. The unit is the growing region.

What happens when it is cloudy?

Cloud cover over a region can blank that week's read. The file flags the week and leaves it empty.

Do you give a yield forecast?

No. There is no yield guarantee, only condition and planted-area signals.

Which pass supplies a given week?

Ask us for the pass schedule for your regions. Each row is dated by week, so build your model on the week.

Can I check it against my own data?

Yes. The series is a plain file, so you can line it up against your scout reports, your yield model or the official ratings.

How is it priced?

By subscription. Talk to us about your regions and crops for a quote.

Can you backfill past seasons?

Ask us. History depends on the regions you name, and it is covered in the first conversation.

Name the regions you trade.

Tell us the growing regions and crops. We come back with how the feed would cover them.

Get started